
What this guide is really about
Search for the best time to post on Threads and you will get confident answers that do not agree with each other. Buffer's large-sample study highlights Thursday at 9 a.m. Postpone's timing data points to Monday, Thursday, and Tuesday between 1 and 3 p.m. Other roundups favor early weekday mornings. They cannot all be right for your account, and most of them are not.
The problem is not that these studies are lazy. It is that they average across millions of posts from accounts in different niches, time zones, and audience sizes, then hand you a single slot as if it were universal. Your audience is a small, specific slice of that aggregate, and it almost certainly does not behave like the average.
This guide takes a different approach. Instead of handing you another magic hour, it shows you why universal averages mislead, what Threads Insights actually measures, and how to run a structured test that finds the real best time for your specific audience.
There is no universal best time to post on Threads for your account. Published studies average millions of posts and disagree. Find your best time with a structured test using your own Threads Insights data. Meta's Insights API gives per-post views, replies, and reposts, but not a time-of-day breakdown.
Understand why universal best-time lists conflict and what that means for your account
Learn exactly what Threads Insights measures and what it does not
Get a repeatable 4-week test to find your audience's real best posting window
Know how to read your results without overfitting to noise
Universal best-time studies disagree because they aggregate across very different accounts, so their averages rarely match your specific audience.
Meta's Threads Insights API provides per-post media metrics like views, replies, and reposts, plus separate user-level totals, but it does not break a post's performance down by hour of day, so you must pair your own post timestamps with those metrics.
A structured 4-week test, where you rotate posting slots while holding content quality roughly constant, produces data that actually reflects your audience.
Small accounts should expect wide variance and should read reply and repost rates alongside raw views before trusting a single winning slot.
Industry data is useful as a starting hypothesis, not a final answer, and the further your audience is from the mainstream, the less reliable it becomes.
Why Universal Best-Time Lists Disagree With Each Other
Open three popular answers on the best time to post on Threads and you will likely see three different recommendations. Buffer's analysis of roughly 2.5 million Threads posts names Thursday at 9 a.m. as the peak engagement slot. Postpone's public timing tool points to Monday, Thursday, and Tuesday between 1 and 3 p.m. Other roundups lean on early weekday mornings, often Tuesday through Friday in the 6 to 9 a.m. window. These are not rounding errors. They are different recommendations built on different samples.
The reason is simple once you see how the data is built. Each study pulls a large sample of posts, calculates which posting times produced the highest average engagement across that sample, and reports the top slot. But the samples are different. They come from different time ranges, different account sizes, different industries, and different geographic mixes. When you average across all of that, the peak reflects the center of mass of the sample, not the behavior of any individual account.
Your audience is almost never that average. If you write for software engineers in Europe, run a parenting account aimed at United States East Coast parents, or build a B2B brand around a niche workflow tool, your followers scroll at times that have very little to do with the aggregate. A universal average can point you toward a slot that is genuinely wrong for you, and you would never know unless you tested.
What Threads Insights Actually Measures (And What It Does Not)
Before you test, you need to know what data is available. According to the official Threads Insights API documentation, Meta exposes six per-post media metrics: views, likes, replies, reposts, quotes, and shares. Separate user-level insights add profile and account totals such as follower counts and link clicks over a date range. The per-post media metrics are the raw materials you have for judging whether a posting time worked.
What Threads Insights does not give you is a time-of-day breakdown for each post. Media insights return lifetime totals on the post. User insights can show daily totals for the account, but neither surface is an hour-by-hour engagement heatmap for a single post. There is no audience-active-times report that tells you how many views came from the 9 a.m. hour versus the 9 p.m. hour. That gap is why universal lists cannot simply be replaced by opening your analytics dashboard.
The practical implication is that the only reliable signal you have is the timestamp when you published, paired with the post's eventual metrics. To find your best time, you have to run something close to an experiment: publish at known, controlled times and compare what happens. That is what the next section lays out.
If you have not yet read it, the threads analytics explained guide walks through how to interpret each of these metrics in plain terms and which ones actually correlate with account growth. This article focuses specifically on the timing question.
The 4-Week Posting-Time Test
This is the core method. The goal is to compare a small set of candidate posting times while keeping as much else constant as possible, so that any difference in performance is more likely to be about timing than about content quality or topic.
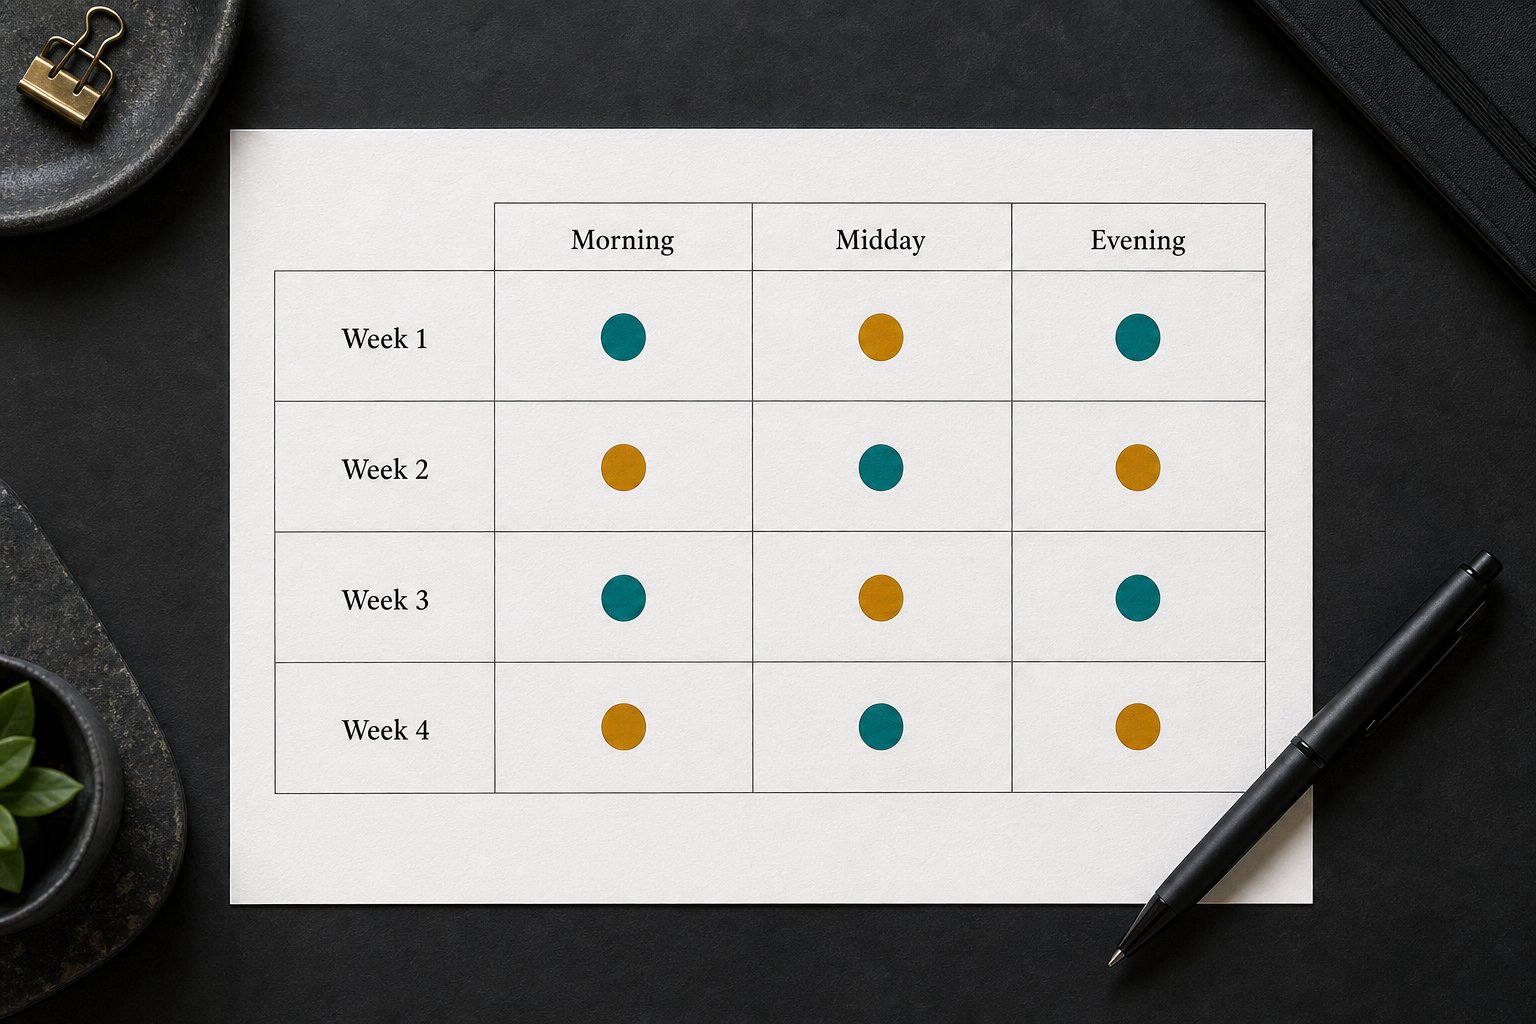
Pick three candidate slots based on a reasonable hypothesis. You might start from one of the published studies as a hypothesis, or from when you personally notice your audience replying, or from the time zone of your largest audience segment. Write the slots down as fixed clock times, for example 8:00 a.m., 12:30 p.m., and 6:00 p.m. in your audience's primary time zone.
Across four weeks, rotate through the slots. A simple rotation looks like this: Week 1, post in slot A in the morning and slot B in the afternoon on alternate days. Week 2, rotate so each slot gets roughly equal turns at different parts of the week. By the end of four weeks, each candidate slot should have at least 8 to 10 posts behind it, spread across weekdays so you are not confounding time with day-of-week.
Hold content quality as constant as you can. Use the same mix of post types across slots: roughly similar share of text-only posts, image posts, and questions. Avoid posting your strongest hook only in the morning slot and your weakest only at night. If you batch content in advance, a threads content calendar template makes it easier to assign comparable posts to each slot rather than improvising. Log every post in a simple spreadsheet with four columns: post timestamp, slot label, post type, and the metrics from Threads Insights after 72 hours. Seventy-two hours is a practical review window: long enough for slower replies to show up, short enough that you can keep the test moving. Treat it as a consistent cutoff across every slot, not as a proven platform law about when reach ends. At the end of the test you will have a small but real dataset that reflects your actual audience rather than an industry average.
Treating a single viral post in one slot as proof that the slot is your best time. One outlier can flip a small-sample ranking. Recalculate without it.
Comparing slots using only raw views. Views without reply or repost context can hide the fact that a slot reaches a broad but disengaged audience.
Confounding time of day with day of week. If you only post in your morning slot on weekdays and your evening slot on weekends, you are testing two variables at once.
Trusting a 5 to 10 percent difference as meaningful with fewer than 15 posts per slot. Small samples are noisy. Treat near-ties as near-ties.
Letting content quality drift across slots. If your strongest posts always land in your favorite slot, the slot is not winning, the content is.
How to Read Your Results Without Fooling Yourself
Once you have the data, the temptation is to declare whichever slot had the highest average views the winner. Resist that. Small samples produce noisy rankings, and a single viral post in one slot can make a mediocre time look like a goldmine.
Start by looking at reply rate and repost rate alongside raw views. A slot with high views but almost no replies may mean your post surfaced to a broad but disengaged audience. A slot with fewer views but a high reply rate may mean you reached the people who actually care. For most creators, replies and reposts correlate more strongly with long-term growth than raw impressions, because they signal that the content connected.
Watch for outliers. If one post in a slot took off for reasons unrelated to timing, maybe it hit a trending topic or got quoted by a larger account, set it aside and recalculate the slot average without it. You are looking for the slot that performs well consistently, not the slot that had one lucky post.
Be honest about sample size. With 8 to 10 posts per slot, you can spot large differences but not subtle ones. If two slots are within 15 to 20 percent of each other on reply rate, treat them as roughly tied and pick based on which fits your workflow. Pretending a 5 percent difference is meaningful will just send you chasing noise.

When Industry Data Still Helps (And When It Does Not)
This is not an argument that universal studies are useless. They are useful as hypotheses. If three independent analyses all converge on weekday mornings outperforming evenings, that is a reasonable starting point for your test, especially if you have no other signal. Use the aggregate to choose which slots to test, not to decide the answer in advance.
Industry data becomes less reliable the further your audience is from the mainstream sample. A consumer lifestyle account aimed at a broad United States audience probably tracks the averages more closely than a developer tools account aimed at engineering managers in specific time zones. Regulated industries, B2B niches, and non-English audiences all diverge from the typical study sample, and for those accounts, the test matters most.
It also helps to remember that timing is one input among many. A great hook published at a slightly off-peak time will usually outperform a weak hook published at the perfect time. If you want a broader framework for combining timing with content strategy and measurement, the how to grow on Threads playbook lays out how to think about the inputs you can actually control.
Turning Test Results Into a Real Posting Schedule
Once you have a slot or two that consistently outperforms, the next step is to build them into a weekly rhythm. You do not need to post only at the single best time. Most accounts end up with a small set of reliable windows, and the goal is to fill those slots with your strongest ideas rather than to optimize every post to the minute.
Map your best slots against your content pillars so each slot gets a rotation of post types that fit the audience that tends to be online then. Mornings might favor quick takes and questions; afternoons might favor longer explanations or behind-the-scenes posts. The social media content pillars guide walks through how to define those pillars in the first place, which makes this scheduling step far easier.
If you schedule posts rather than publishing live, the scheduling mechanics matter as much as the timing decision. Depending on your setup, that may mean the native Threads composer where scheduling is available, the official Threads API publishing flow, or a scheduler built on top of the API. The how to schedule Threads posts guide covers the practical workflow options, including what to do when a scheduled post needs last-minute edits.
For the actual writing, a tool like the free Threads post creator can help you draft posts that fit the slot and the audience you expect to be online. Drafting in advance is what makes a consistent posting schedule possible without scrambling every day.
Action checklist
Use this as the practical next pass after reading the guide.
- +Pick three candidate posting slots based on a hypothesis from industry data or your audience's likely time zone.
- +Batch comparable posts in advance so each slot gets roughly equal content quality and post-type mix.
- +Rotate slots across weekdays for four weeks so each slot lands on different days.
- +Log timestamp, slot, post type, and 72-hour metrics for every post in a simple spreadsheet.
- +Compare slots on reply rate and repost rate, not just raw views, and remove outliers before ranking.
- +Lock in the one or two slots that consistently perform and build them into your weekly content calendar.
Conclusion
The honest answer to when you should post on Threads is that nobody else's dataset can tell you. Universal studies disagree because they average across accounts that are nothing like yours, and even the official Threads Insights API does not break performance down by hour. The only dependable method is to run your own test.
Pick a few slots, hold content quality constant, rotate across weeks, and read the results with the right skepticism toward small samples. What you find will almost certainly differ from the published lists, and it will be more useful because it describes the audience you actually have.
Once you know your real best windows, the work shifts from chasing magic hours to filling those slots with posts worth reading. That beats refreshing another universal ranking every few months.