Threads analytics should answer a small number of decisions: which ideas deserve another attempt, which formats fit the account, and whether distribution is improving or weakening.
A single viral post is not a strategy, and one weak post is not proof of suppression. Compare mature outcomes across groups of posts and keep the raw post examples attached to the numbers.
Quick answer
Use views to understand distribution, replies to understand conversation, reposts and quotes to understand sharing, and follower trends to understand account growth. Compare posts with your own recent baseline before changing strategy.
Start with the metrics Threads actually provides
Meta lists views, replies, reposts, quotes, follower trends, and audience information among Threads insights. See the official feature announcement for the supported measurement categories.
The available detail can vary by surface and account. Treat missing data as missing, not as zero. A row without a fetched view count should never become proof that the post had no reach.
Read views as distribution, not approval
Views tell you how far the post was shown. They do not tell you whether the right people saw it, remembered it, or took an action. Use views alongside the post’s purpose and the quality of the responses.
Compare similar post ages. A post that has been live for two hours should not be judged against one that has collected views for several days.
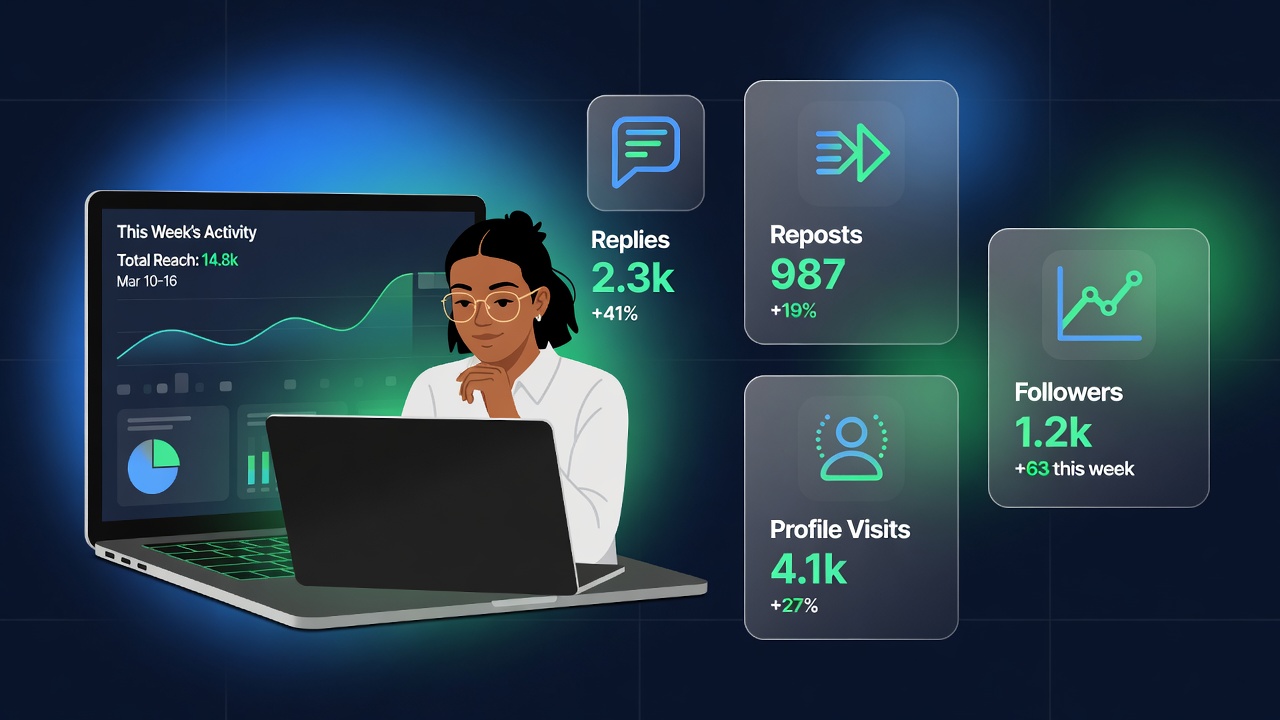
Separate conversation from lightweight reaction
Likes are a low-friction signal. Replies require more effort and can reveal whether the opening created a real conversational gap. Reposts and quotes indicate that someone chose to carry the idea into another context.
No single rate is universally good. Build an account-relative baseline using mature posts, then inspect the exact winners and misses instead of optimizing a ratio in isolation.
Group posts before drawing conclusions
Tag posts by topic, structure, purpose, and origin. Compare several examples from the same family. This helps separate a strong concept from a lucky distribution event and prevents one post from rewriting the whole strategy.
Recent evidence should matter more when the platform, audience, or account direction changes. Older winners remain useful references, but their children must continue earning trust.
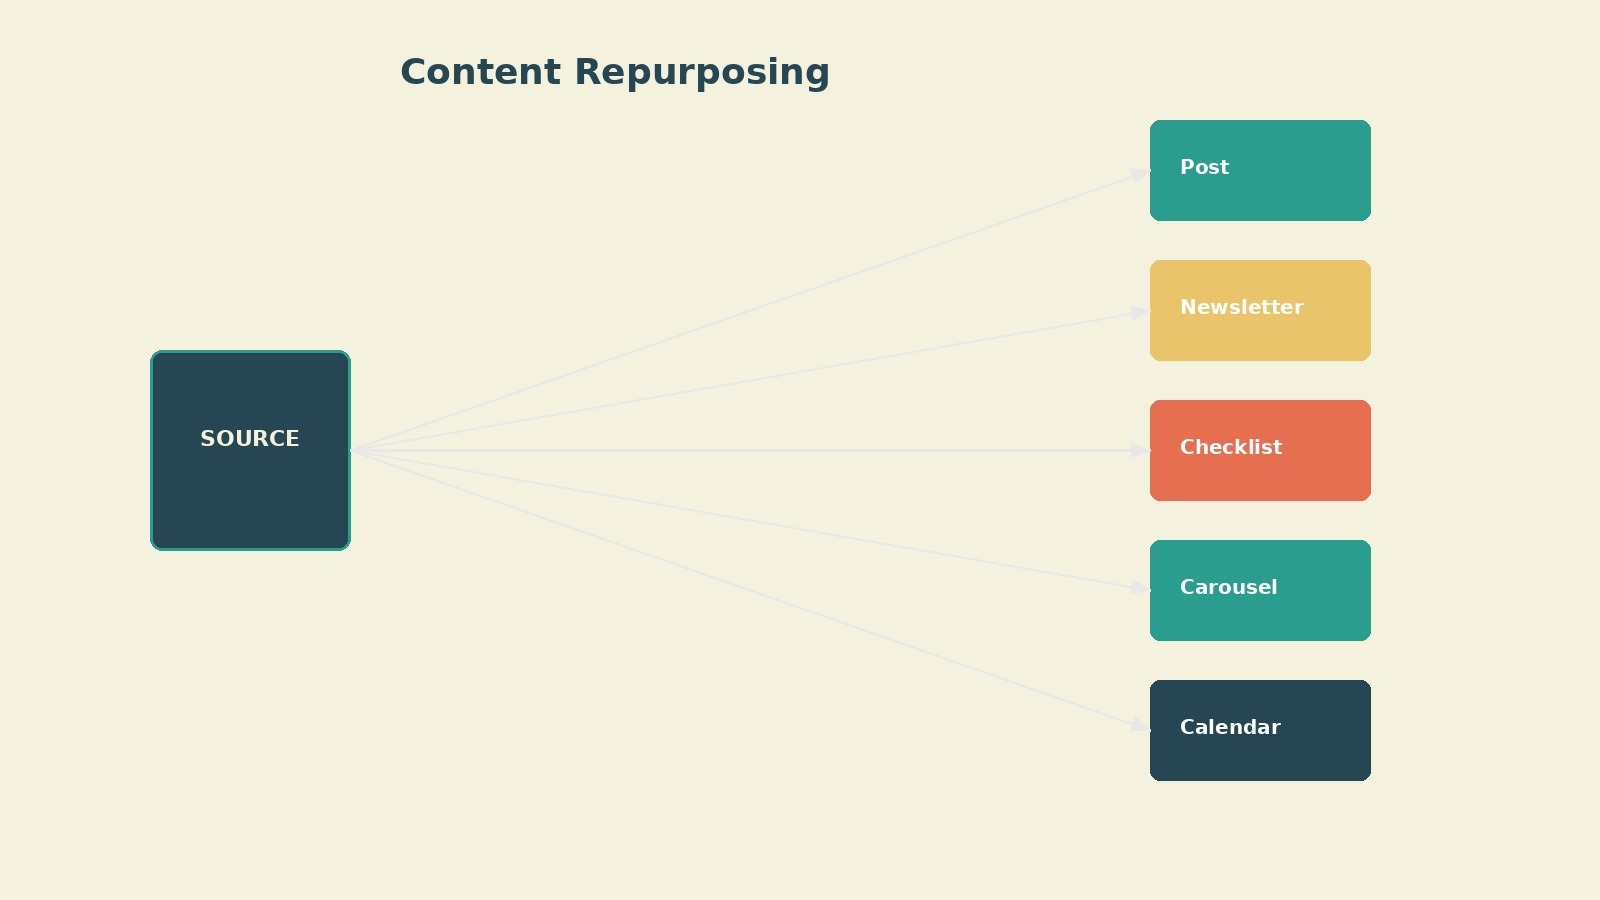
Turn insights into the next draft
Choose one adjustment at a time: a clearer opening, a narrower topic, more useful specificity, or a different format. If several elements change together, you will not know what helped.
JoltSage connects post-level outcomes to seeds and generation history so users can review what worked without sharing private text across accounts. Learn more on the Threads Insights page.
Action checklist
- Wait for comparable post ages
- Treat missing metrics as missing
- Compare against the account’s own baseline
- Inspect exact posts behind every average
- Change one major variable in the next test