
What this guide is really about
You post on Threads, someone clicks your link, and then what? If your only evidence of social traffic is a like count, you are guessing about the part that pays. Google Analytics 4, or GA4, is the free tool that shows which platforms and posts actually send people to your site, and it answers a question no platform dashboard can: what happened after the click.
Most GA4 guides are written for marketing teams with budgets and funnels. This one is written for one person with a link in bio. It covers the smallest useful setup, the only three reports you need in your first weeks, and the parts of the data that look broken but are not. You will also see what is safe to ignore, which is most of the interface.
In GA4, open Reports, then Acquisition, then Traffic acquisition. Filter Session default channel group to Organic Social, then change the primary dimension to Session source / medium for the networks. Tag links with UTMs, or many social clicks land under Direct. Read four-week windows, not daily swings: at creator volume, single sessions and missing sources are normal.
Get GA4 collecting data on your site in one sitting
Find your social traffic in three reports, not thirty
Understand where missing social clicks actually go
Know which GA4 numbers a solo creator can safely ignore
GA4 measures properties you control (a website or app stream), not your social accounts. It counts arrivals, key events, and purchase-shaped actions after the click, and it never sees likes or reach.
Traffic acquisition, filtered to Organic Social, plus Session source / medium is the core view for a creator. Dimensions with Session in the name describe the visit that just happened.
Direct is the default label when no source is known. In-app browsers, link wrappers, and redirects can all push real social clicks into Direct, so tag links with UTMs before blaming the algorithm.
At low volume, one enthusiastic reader can flip a daily chart. Compare four-week windows and look for repeat patterns instead of reacting to single days.
Most of GA4 can be ignored in your first weeks: monetization events, Ads-linked tabs, user attributes, and explorations can wait until the basics earn them.
What GA4 Actually Measures (and What It Never Sees)
GA4 is a website analytics tool. It records what people do on your site: which page they arrived on, where the session came from, and which actions you have marked as important. It does not measure your Threads account, your Instagram reach, or your reply rate. Those numbers live in the platform's own insights, and GA4 picks up the story only when somebody clicks through to something you own.
That division of labor is the point. Platform dashboards tell you how the post performed in the feed. GA4 tells you whether the people who clicked did anything worth doing: read a second page, joined a list, started a checkout, or booked a call. If you sell anything, link anywhere, or collect email addresses, GA4 is where posting effort connects to results.
Two vocabulary shifts trip up social-media people. First, GA4 calls anything you want to count an event, and the events that matter most to you can be marked as key events, the important outcomes Google surfaces in GA4 reports (Google Ads still uses the separate word conversions). Second, the word session matters: dimensions with Session in the name, like Session default channel group, describe the visit a user just made, while First user dimensions describe how they originally found you. For judging last week's posts, you want the Session ones. Google's own documentation of the Traffic acquisition report defines these cross-channel dimensions and notes they describe a user's most recent session.
Day One: The Smallest Useful Setup
Start at analytics.google.com and create a property, then a data stream for your website, then place the Google tag as the setup wizard directs, using your site builder's integration field or a lightweight plugin. Google documents the full sequence in its setup guide, and the wizard handles most of it. If your links currently go through a link-in-bio page or a redirect service, leave them alone for now. You are not debugging attribution today; you are starting collection.
Two settings deserve five minutes on day one. Mark one action as a key event, ideally something a genuine fan does: email signup, booking, or an add-to-cart if you sell. Enhanced measurement records some events automatically, but a key event is the number you will actually read, and Google's key events documentation explains how marking one surfaces it across reports. Second, if you use a link-in-bio tool, add your UTMs inside that tool so tagged links reach GA4 intact.
Then stop. Resist configuring fourteen things before any data exists. GA4 can show realtime hits the same day, but patterns need days of arrivals, and every extra setting you touch before that is a future confusion you planted yourself. The goal of day one is a running property plus one honest key event, nothing more.
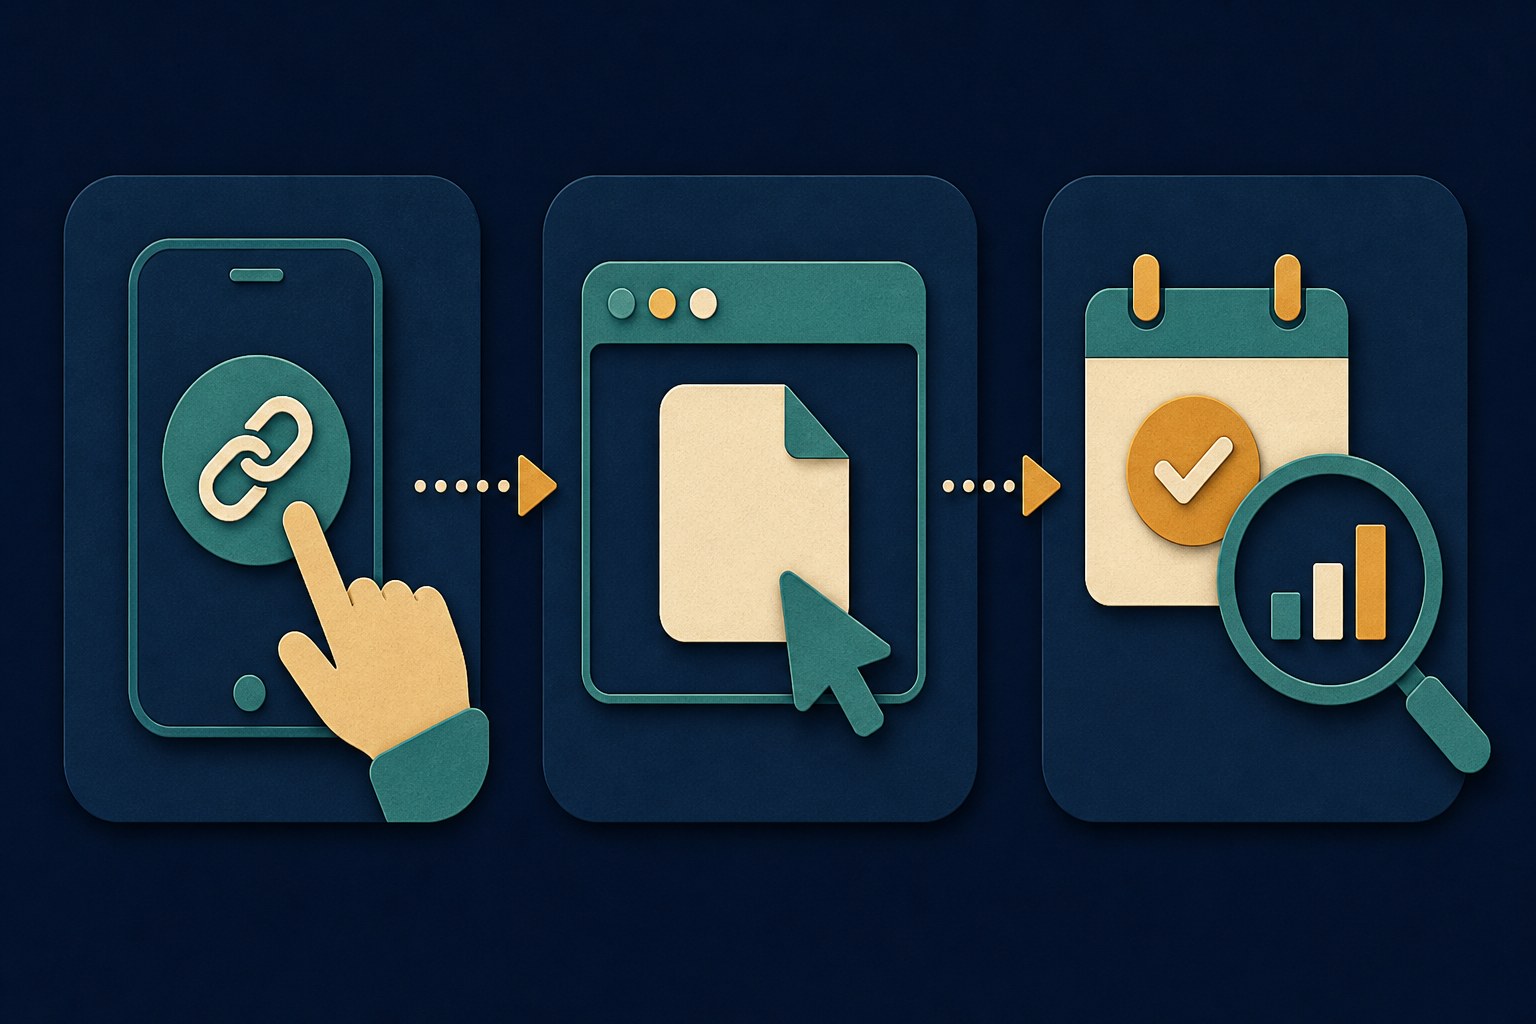
The Three Reports Worth Opening
Report one is Traffic acquisition under Reports, then Acquisition. It is your default home. The Session default channel group column buckets arrivals into Organic Social, Paid Social, Organic Search, Direct, Referral, and more. Filter to Organic Social to hide search and direct. That bucket is not every social click: TikTok and YouTube often land in Organic Video, and untagged in-app clicks often land in Direct. A week in, this view answers whether tagged, classifiable social visits showed up.
Report two is the same report with the primary dimension changed. Click the current dimension name (Session default channel group) and switch it to Session source / medium. Untagged Threads or Instagram clicks, when the referrer survives, usually look like threads.net / referral or instagram.com / referral, not / organic. Tagged links show the values you set, such as threads / social. (not set) here means that dimension had no value, not social with the network missing.
Report three is Engagement, then Pages and screens. Social visitors arrive cold, mid-scroll, and on a phone. Which pages do they actually read? If your long essays die on arrival from social but your templates page converts, that is a strategy finding you cannot see from inside any social app. Check this view before redesigning anything, because it is the cheapest audience research you own.
Three reports, two dimensions, one filter. Everything else in GA4 can wait, and the rest of this piece is about reading what these three show you honestly.
Reading daily swings at creator volume. One devoted reader can flip a day. Compare four-week windows.
Leaving links untagged, then concluding social sends no traffic when the arrivals sit inside Direct.
Treating (not set) as a broken install. It usually means a dimension had no value, often a partial UTM set, not a missing Google tag.
Marking twenty events as key events. Pick one genuine reader action; a key event that means nothing dilutes every report.
Comparing GA4 sessions to platform impressions. They count different things: feeds scrolled versus people who left the app to visit you.
The Messy Middle: Direct, (not set), and In-App Browsers
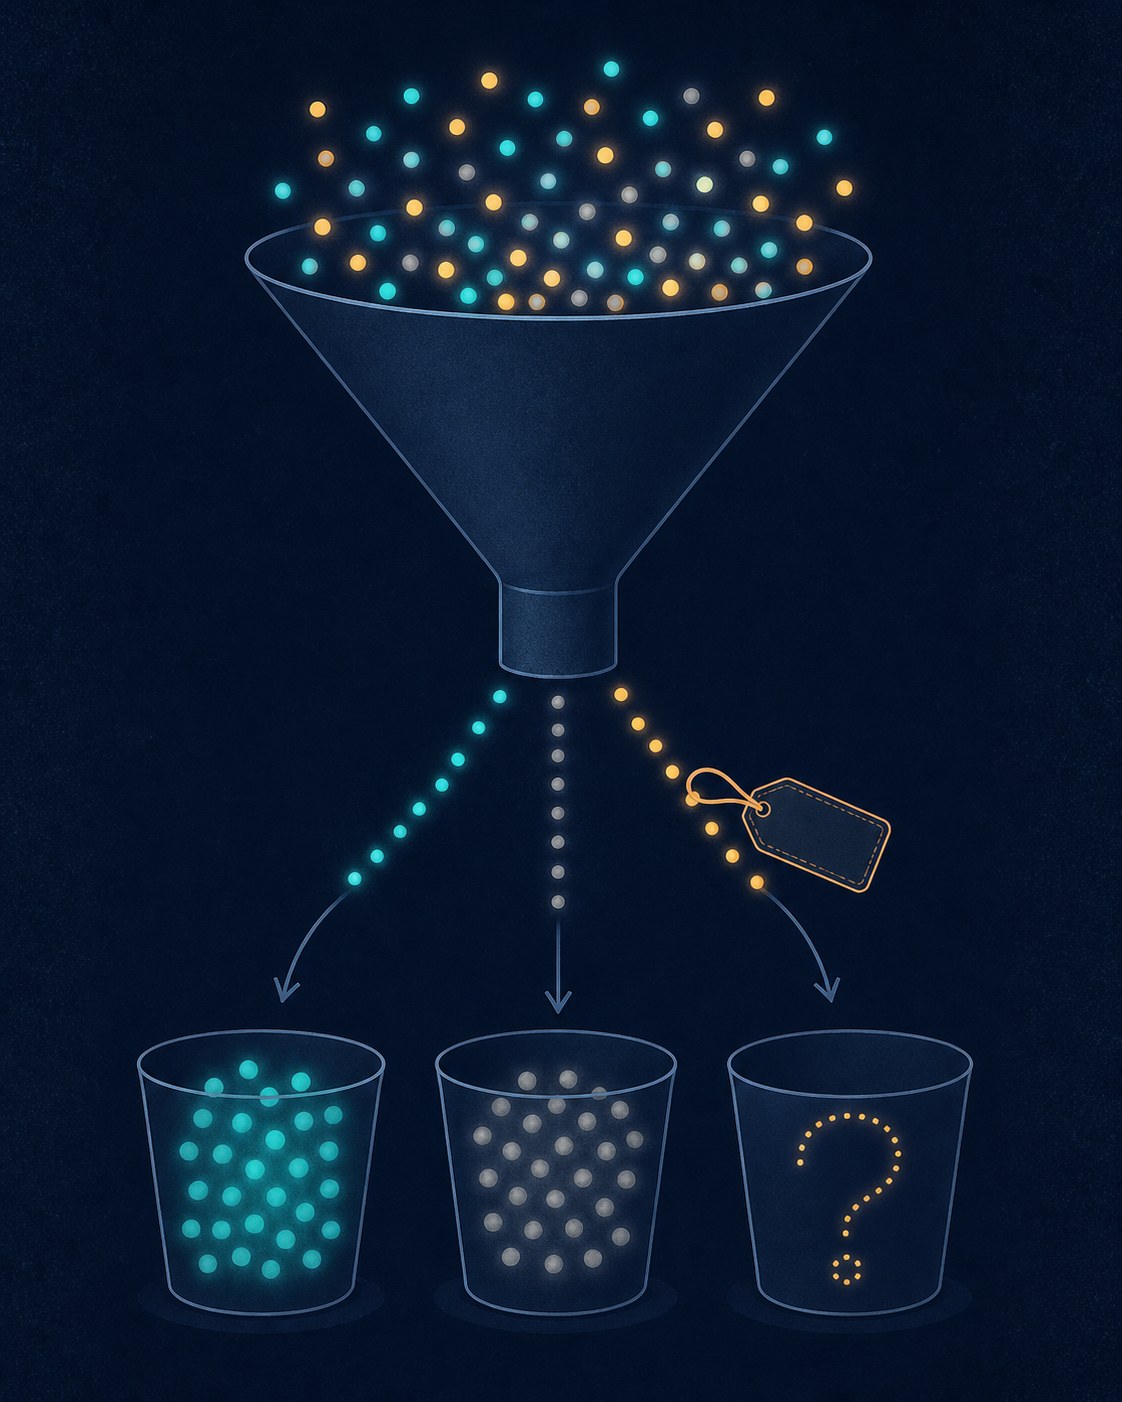
Here is the part vendor tutorials skip. When you filter to Organic Social and the numbers look smaller than your platform dashboards imply, the clicks did not vanish. They were relabeled. GA4 files a session as Direct when source is (direct) and medium is (none) or (not set). Google describes that as a typed or saved URL; in practice, in-app browsers, link wrappers, and some redirects also strip the referrer, so real social arrivals often land in Direct.
The (not set) value means GA4 did not receive data for that dimension. On source / medium it often appears when a link has some UTM parameters but not the rest, which Google warns will fill missing slots as (not set). Unassigned is different: it is the channel group when no default-channel rule matches, usually a made-up medium. Neither means reinstall the tag. Both can mean your labels are incomplete.
The fix is not more configuration. It is labeling your links before you post them. When you control the URL, set UTM parameters together (source, medium, campaign) so GA4 is not guessing from a referrer. Use utm_medium=social for organic posts so the default channel group can class them as Organic Social. If you want the naming rules and the direct-traffic traps in depth, read our UTM tracking guide next; this page stays on how those rows show up in GA4.
One more trap: UTM parameters are case-sensitive and typo-sensitive. threads, Threads, and threads_app are three different sources in your reports, so freeze a convention early and stick to it.
A Worked Week: Reading the Numbers Like a Creator
Imagine a hypothetical week. You posted four times with links, saw 900 impressions on the platform, and GA4 shows Organic Social at 14 sessions with 22 Direct. The instinct is deflation: 14? But impressions count feeds, not people deciding to leave the app, and Direct almost certainly contains more of your readers than you think. Fourteen confirmed arrivals plus an unknown slice of 22 unknowns is not nothing. It is a baseline.
Week two, you tag every link. Same posting rhythm, and now Organic Social plus your tagged campaign rows show 19 sessions while Direct falls to 15. Nothing about your content changed. Your measurement changed. That is the quiet win most creators never see because they never label their links, and it is why week one's numbers are calibration, not verdict.
Week three, you check Engagement, Pages and find social arrivals read your pricing page and a templates page far more than your essays. The honest reading is not my essays failed. It is social readers want tools and answers, and essays find their people through search and newsletters. You now have evidence for a content mix instead of a vibe.
The habit to build is one fifteen-minute slot: Traffic acquisition for the channel and source / medium split, then Pages and screens for what those arrivals read. Compare four-week windows, not single days, because at creator volumes a single enthusiastic reader can flip a daily chart. For the in-app half of that slot, our Threads analytics walkthrough covers which Threads metrics are worth the same fifteen minutes.
The Threads-to-GA4 Bridge
Threads gives you a profile link, and many accounts can add links in posts; every click on those links is a potential GA4 session. When a referrer survives, you may see a threads.net host in source / medium, but in-app browsers strip that often enough that you should not rely on it. The practical move is to tag: a UTM campaign per post topic, not per post, so after a month you can say templates content brings readers while announcements do not.
One practical constraint shapes the workflow: the 500-character budget. A URL plus parameters costs characters, so tag briefly and write the post around the leftover count. The free Threads post creator keeps the copy inside that limit; it does not build UTM links for you.
The deeper habit GA4 enables is closing the loop between what you publish and what readers do. Post with a tagged link, watch which topics arrive and read, and let that change next week's mix. That loop is the whole difference between posting into the void and operating a small media property with evidence.
What to Ignore in Your First Weeks
GA4 ships with an enormous surface area, and most of it is noise for a solo creator right now. Ignore monetization events and ads-linked tabs until you run ads. Ignore Explorations until the three core reports feel slow. Ignore user attributes and demographics caveats at low volume, and skip obsessing over engagement rate inside GA4; it is a website metric, not a social one. For platform-side rates, our engagement rate benchmarks piece explains how to read those numbers without panic.
The numbers worth your attention are few: sessions from social channels (and Organic Video if you post there), the source / medium split underneath them, key events from those sessions, and the pages social readers actually open. Four numbers, tracked weekly, beat every dashboard you are not going to open. Setup honestly takes an afternoon, the reading habit takes fifteen minutes a week, and together they answer the question every link-posting creator eventually asks: is this working?
Action checklist
Use this as the practical next pass after reading the guide.
- +Create the GA4 property, web data stream, and Google tag today
- +Mark one genuine reader action as a key event
- +Open Traffic acquisition and filter Session default channel group to Organic Social (check Organic Video separately if you use TikTok or YouTube)
- +Change the primary dimension to Session source / medium and note your real network split
- +Tag every outbound link with a frozen UTM convention before posting
- +Book a recurring fifteen-minute weekly review of Traffic acquisition plus Pages and screens

Conclusion
GA4 will not tell you how to write a better hook, and it cannot see the conversation happening inside your social app. What it does is close the loop you actually control: post, click, arrive, read, act. An afternoon of setup and fifteen minutes a week of reading turns social posting from a bet on vibes into a small, observable system. Start the clock this week, tag your links, and let the first month calibrate before you judge it.